
The use of bright colours, illustrated characters and bold text instantly grabs everyone’s attention and gives a quick overview of a topic as you skim through it. A layman’s attention span only lasts about eight seconds and keeping this in mind, the Advertising agencies often communicate through pictures as that draws more attention. Hence, the world of infographics has gained a lot of popularity.
What is an Infographic?
“Infographic” is a portmanteau of the words “information” and “graphic.” It is a visual representation of any kind of information or data. Whether it’s a study on market trends or a step-by-step guide on how to do your laundry, an infographic can help you present that information in the form of an attractive visual graphic. The goal of an infographic is not only to inform but also to make the viewing experience fun and engaging for your audience which is a key player in Digital Marketing.
All of this comes down to how efficiently you can combine different elements like colours, icons, images, illustrations and fonts to explain a topic in a compelling and easy-to-understand way. From Digital Marketing and Advertising to schools and classrooms, infographics are being used everywhere to communicate complex information in a visually engaging way. As the amount of data being amassed in the enterprise and elsewhere increases, infographics are being used more and more frequently to help people understand the information contained in that data.
Why use Infographics?
There’s a reason why infographics are so popular with Digital Marketing – they are easy to share and human beings are highly visual and because 90% of the information that comes to the brain is visual you need to tap into that “optic nerve”.
Digital Marketers want to expand their business universally and in a world where online publishing is now visible globally at the push of a button, infographics can provide global coverage that local print media could never do.
The viral nature of the infographic medium makes people link to the site and Google will index the website higher due to Google’s “Page Rank” algorithm. This increases the importance that search engines pace on the site. In addition to this, it will show Advertisers in good light as the research required to create an infographic will display the knowledge and position them as an expert on your category or topic.
How can one create an Infographic?
Step 1- Choose a template
There are hundreds of free and premium infographic templates best suited for Digital Marketers and Advertisers that they can find with just one click. They can subsequently pick what works best for their content and purpose.
Step 2 – Customize with your content
When you select a template to edit, you get to customize the infographic with your colours, fonts, text, images, icons and much more and make it entirely your own. You can change the entire colour scheme of your infographic in one go using various preset colour themes.
Step 3 – Download and Share
After you’ve finished customizing your infographic, it’s time to download it or share it with your audience in a variety of ways. You can either download it for offline use in image, PDF or HTML5 formats. Or generate a link to share it privately with specific people.
What are the different types of Infographics?
While there are many different presentations of infographics, there are three general categories that infographics can fall into:
- Data Visualisation
- Information Design
- Editorial Infographics
Each serves its own purpose and can be a powerful storytelling tool—when applied properly.
- Data Visualisation
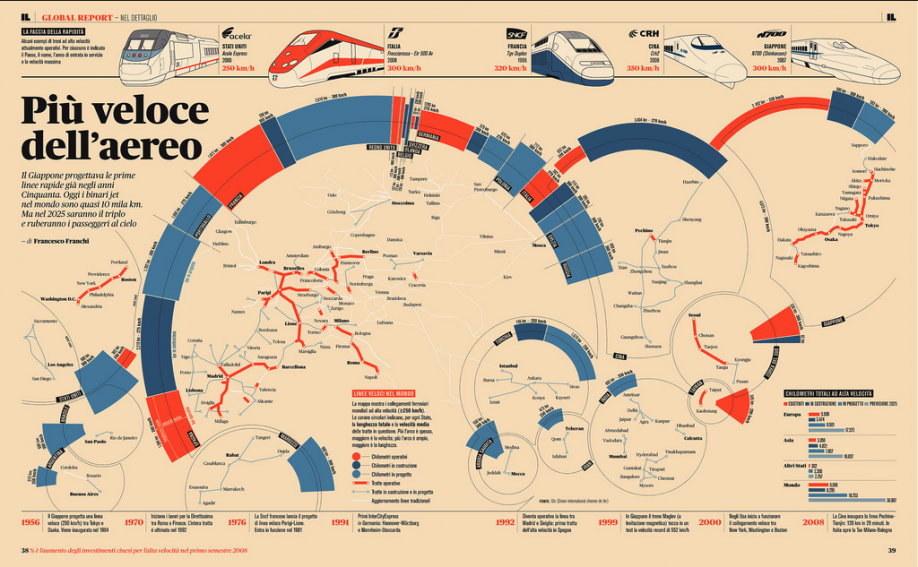
Data visualization is simply a visual representation of data. We consider it an artistic science, as it uses design aesthetics to increase data comprehension, synthesis, and ultimately recall. Whether you’re looking at meta patterns or single data points, data visualization translates that data into a visual language you can easily and instantly understand. In the age of big data, this is especially important. We need to both make sense of numbers and be able to easily share the story they tell.
Example: You probably don’t speak Italian, but you can likely decipher the information presented in this graphic by Francesco Franchi. This illustrates why data visualization is the most interesting and universal way to make information accessible and understandable to a wide group of people.
- Information Design
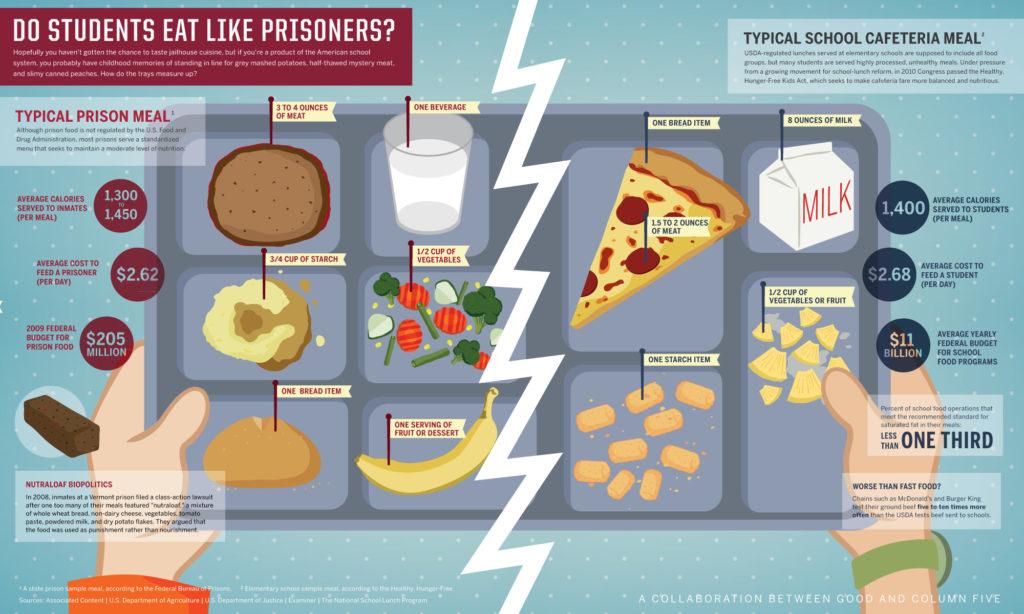
Information design is a subset of graphic design that focuses on the display of information efficiently and effectively. It’s a broad category, encompassing many functional design disciplines. It differs from data visualization because it is not made from specific data points but rather concepts or other information, such as process, anatomy, chronology, or hierarchy.
Example: This piece of information design by GOOD compares prison food to school lunches.
- Editorial Infographics
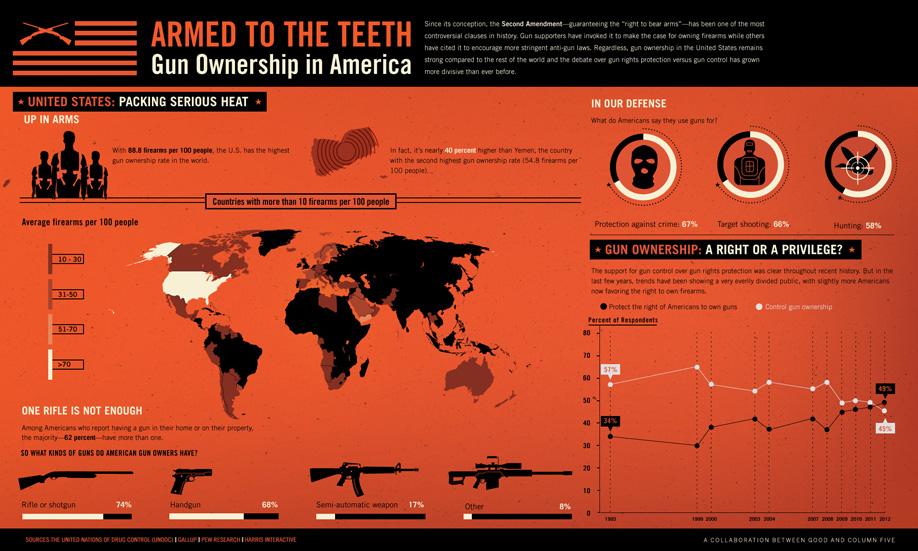
Although major publications have been featuring infographics for decades, there is a shift in the style and type of visual content they are producing. This trend has also been spurred by the rise of social. Infographics have become highly shareable content, so publications are embracing the medium to better engage readers. Previously, editorial infographics were limited to simple bars, lines, and pie charts, using illustration solely in more complex features to map an area or show the anatomy of an object.
Example: A GOOD magazine infographic on gun ownership.
As Advertisers, the main goal is to catch the viewers eyes and keep them hooked on the product or service and that is the purpose of an Infographic. It is highly important to use the design and colour scheme that works best for your product or service in order to get the best results.